EPD’S PREDICT PROGENY PERFORMANCE
A Chromosome’s Worth of Difference
- By Sean McGrath, Genetics and Beef Consultant and Rancher
While EPD’s have been around for several decades there is still a lot of confusion about where they come from and their use. A lot of comments I hear relate to the confusion between actual performance of a seedstock animal and the EPD for said animal. So, to understand the difference, let’s go back to the beginning.
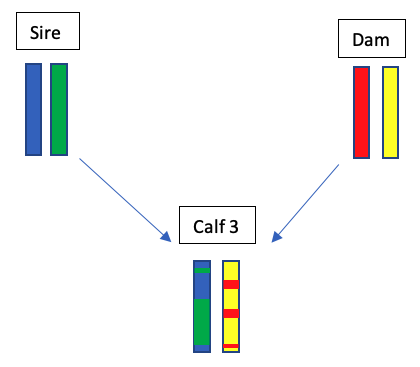
An EPD is an Expected Progeny Difference and it uses all the available information we have to describe an animal’s DNA for a specific trait. The EPD uses the animal’s own performance in its’ calculation but it is not describing the performance of the animal, it reflects the predicted performance differences of the OFFSPRING, not the phenotype of the animal. Let’s look at the following example. We know that DNA is arranged in chromosomes and that chromosomes come in pairs. (Cows have 30 pairs or 60 chromosomes total). For this example, let’s simplify and only look at one chromosome.
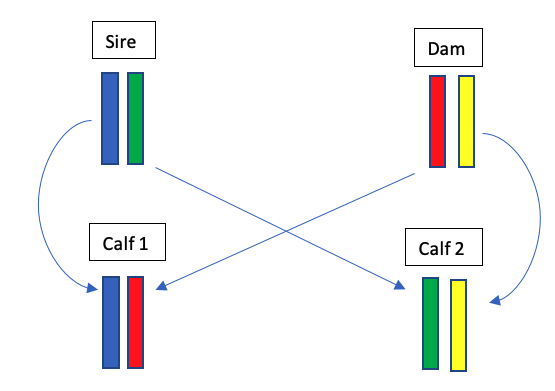 In this example, we can see full sib calves (Calf 1 and Calf 2), that wind up with completely different chromosomes from the parents, and thus they could have completely different DNA for various traits. A good example of this in the real world is that of bulls and heifers. We know that bull calves get an X and a Y chromosome at pair number 30 and heifers receive 2 X chromosomes. We could have full sib calves, but a heifer and a bull have obvious differences caused by having a completely different chromosome.
To further complicate things, when the sire and dam are replicating their DNA, parts of the various chromosomes can swap places. If we were to use our example, we could end up with a calf that looks like Calf 3. The multitude of potential combinations runs into the billions, even if we are talking about a single sire & dam mating. This is the reason that we need EPD’s.
On average a calf is somewhere in the middle of the sire and dam, however the parents genes are not inherited equally by siblings, so obtaining more information allows us to better predict which DNA that calf is carrying and thus can pass on to their offspring.
 As we add information, we can do a better job of predicting differences between cattle and we are more sure of the results. We express the amount of information included in an EPD in terms of accuracy. Since an EPD is a reflection of DNA that can be passed on to progeny, measuring progeny is the ultimate information, but measuring the actual animal is a good first step. As we add progeny measures, the impact of pedigree, DNA and the animal’s own performance declines in overall importance.
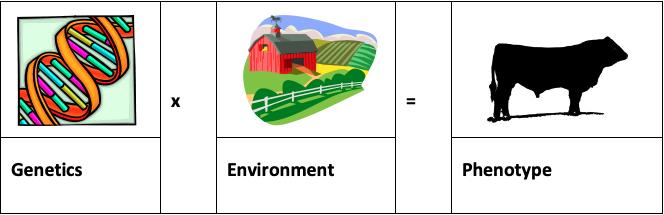
So, to back up a step, each animal is the result of the DNA they receive/contain, interacting with their environment. We call the actual performance/appearance of the animal the phenotype. Initially we know pedigree information on each bull. If we take performance measurements of phenotype we can determine their performance relative to other animals that are managed in the same way (the same environment).
 This same environment is what we refer to as a management group. A contemporary group is a further refinement. It includes animals of the same sex, of roughly the same age and raised in the same environment. If the environment is the same, then a lot of the differences we see between phenotypes are due to genetics or differences in DNA. This is why performance data can create dramatic changes in an animal’s EPD that are predicted from pedigree alone. Once we know the genetic component of those performance differences, we can compare these differences across herds by using pedigree ties.
We can now further refine this, by looking at DNA directly using a genomic panel. This obviously also tells us a lot of information about what DNA the animal received from its’ parents and thus can change the EPD significantly as well.
Finally, since the EPD’s are “Expected Progeny Differences” once an animal becomes a sire/dam and passes on its DNA, we can measure the offspring and see what differences are expressed in the progeny.
Let’s go back to Calf 1, 2 and 3 again. From their pedigree we would predict that they would have identical EPD’s, but we can see that they have different DNA. Let’s for a second assume that they were in the same herd, are all bull calves, born in 2020 and were raised together. They are a contemporary group. Their weaning information is shown in Table 1. Based on the weaning information we would predict that Calf 1 has DNA that is superior for growth from either Calf 2 or 3, and that Calf 2 has a genetic combination that is even lower for growth. A DNA test may further confirm this and provide more accuracy or certainty to that prediction. This is shown the example in Table 2. for these three calves.
Table 1. Weaning Weight Performance of Calf 1, 2 and 3
| Calf | Weaning Weight | Deviation |
| 1 | 700 | +50 |
| 2 | 600 | -50 |
| 3 | 650 | 0 |
| Average | 650 | 0 |
Table 2. Weaning Weight EPD and Accuracy () of Calf 1, 2 and 3 as information is added to their profile
| Information in the EPD | |||
| Calf | Pedigree | Performance | DNA |
| 1 | 61 (0.15) | 70 (0.30) | 70 (0.50) |
| 2 | 61 (0.15) | 54 (0.30) | 50 (0.50) |
| 3 | 61 (0.15) | 61 (0.30) | 62 (0.50) |
If these calves were to become sires, then we could measure performance of their progeny and further refine our knowledge of their DNA.
| Information in an EPD | |
| Pedigree | Starting point. Accuracy of 0.10 to 0.15 |
| Individual Performance within Contemporary Group | Provides a good indication of the genetics of the animal. Accuracy of 0.15 to 0.35 depending on the trait |
| DNA Markers | Contributes a lot of accuracy to young animals (animals without progeny records) Accuracy of 0.30 to 0.60 depending on the trait. |
| Progeny/Daughter Records | Provides a true measure of progeny differences. Accuracy of 0.30 to 0.99 depending on number of progeny |
Where to From Here?
A Bull cannot pass on their own performance. The performance of an individual is merely an indication of what DNA they might be carrying that they can pass on to their offspring. While individual performance is useful, management will dictate the expression of genetics, so performance alone can be somewhat misleading. We are really interested in what DNA the animal possesses that it can pass on to offspring.
I have heard the statement made that trade buyers don’t pay for EPD’s, and this is correct. Since we are not expecting any progeny from our steer calves or market animals, we only care about their performance and that is what we are paid on. In the same vein though, commercial breeders are not paid for the individual performance of a sire, they are paid for the expression of his DNA in the marketed offspring or retained females. EPD’s can’t help us with every trait of interest or importance, but they can provide us some insight into the DNA that each animal possesses and will pass on to their offspring.
EPD Movement: “Change is Inevitable”
By Dr. Wade Shafer, Executive Vice President, International Genetic Solutions
Luke Bowman, Director of International Business, International Genetic Solutions
July 28, 2022
This tenet certainly holds true when it comes to genetic evaluation. By now, all of us are well aware that Expected Progeny Differences (EPD) inevitably change over time. Curiously, change, particularly more than moderate change, is often cited as a reason to discount the utility of our genetic evaluation system or to question breeder integrity. For the most part, these are unwarranted deductions. The fact of the matter is, EPDs should change over time — in some cases dramatically.
Change is due to additional data being incorporated into the genetic evaluation data set. To illustrate this change, it is helpful to consider the relationship between estimates and “true” values. Because we aren’t privy to animals’ true genetic values (an accuracy of 1.0), we are required to estimate them through the use of phenotypic observations. As additional observations are collected from one evaluation to the next, EPDs, on average, move closer to the true values they estimate. Change resulting from this “zeroing in” on true values results in more accurate EPDs —certainly a good thing.
Though clearly beneficial, this change can be sizable as EPDs move toward their true values. To demonstrate this fact, let’s look at the possible change (PC) statistic associated with each EPD. Possible change is the range ± an animal’s EPD that, 67 percent of the time, we expect the animal’s true genetic value to fall within. With this in mind, we can make some assumptions; first, in a group of 100 bulls, it is expected that 33 (100 – 67) of them have true genetic values outside a PC unit range from their EPD for a particular trait; second, when considering multiple traits, the number of instances in which true values fall outside PC ranges increases by a multiple of the number of traits. For example, if we consider 15 traits on our sample of 100 bulls, we expect 495 (15 x 33) instances where sires have true values more or less than the PC units from their current EPD.
To add further perspective, let’s take a bull calf with a 60 YW EPD and a corresponding 0.30 accuracy. The PC range for this calf’s EPD is ± 18. If he turns into a high-use AI sire, eventually developing a YW accuracy of 0.99 (i.e., his EPD is essentially his true genetic value), there is a 67percent chance that his 0.99 accuracy EPD will fall between 78-42. As you can see, it would be fairly common (33 percent of the time) for the calf to end up with an EPD over 78 or under 42, a result that would fairly categorize him as either a high- or low-growth bull.
What does all this mean? From my vantage point, this puts into perspective the fact estimates are going to change — in some cases, dramatically. Furthermore, through PC, we are told “upfront” about the range of change to anticipate. Therefore, when a sire moves dramatically, rather than discount our genetic evaluation system or assume there were faulty data submitted on him, we should be more accepting of it — knowing that it is expected to occur at a predicted frequency.