UNDERSTANDING IGS EPD’S
UNDERSTANDING THE IGS EPD SUITE
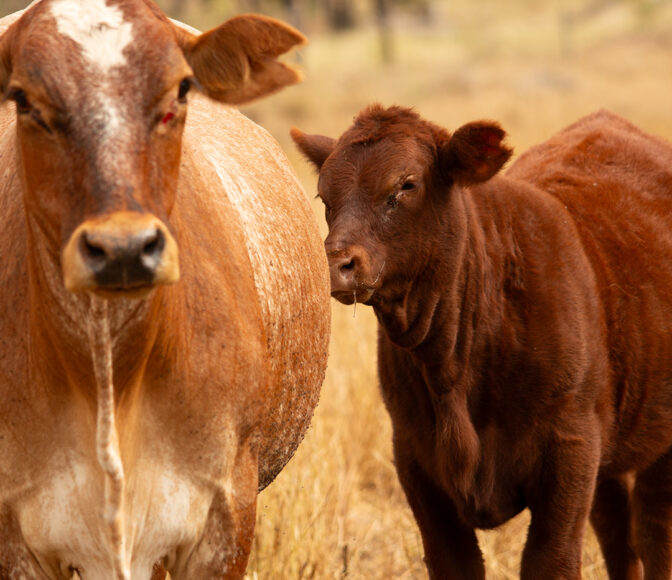
MATERNAL EPDS
CALVING EASE DIRECT (CE-D)
Reported as the percentage of extra unassisted births in first calving heifers, relative to the average.
CE-D is relative to the direct Calving Ease of the animal. Higher values are more favourable.
CALVING EASE MATERNAL (CE-M)
Reported as the percentage of extra unassisted births in first calving heifers, relative to the average. CE-M is relative to the Calving Ease of the daughters of the animal. Higher values are more favourable.
MILK
Reported as pounds of weaning weight of progeny from the animals daughters, relative to the average.
Predicts the difference in maternal production of daughters relative to milk production and mothering.
Values are relative to the environment of the production system. Low input environments should be very consious of introducing too much milk due to the increased nutrient requirements that it can place on cows.
MATERNAL WEANING WEIGHT
Reported as pounds of weaning weight of progeny from the animals daughters, relative to the average.
This is a measure of weaning weight differences relative to the combined effects of growth and milk.
Breeders who are not looking to change milk production should consider Total Maternal as the most relevant EPD for maternal weaning weights. Higher values are more favourable.
STAYABILITY (STAY)
Reported as the differences in percentage of a sire’s offspring that are predicted to still be in the herd at 6 years
of age… given that they calved at 2, relative to the average. Stayability is a measure of reproductive longevity.
Higher values are more favourable.
DOCILITY
Reported as the percentage of progeny, relative to the average, that will record a score of docile.
Higher values are more favourable.
GROWTH EPD’S
BIRTH WEIGHT
Reported in pounds of birth weight relative to the average.
When selecting bulls to use on heifers, breeders should also focus on the Calving Ease EPD as Birthweight is already used in the Calving Ease EPD calculation.
WEANING WEIGHT – ADJUSTED TO 205 DAYS
Reported in pounds of weaning weight of direct progeny, relative to the average.
Higher values are usually more favourable dependant on its relationship with birthweight.
YEARLING WEIGHT – ADJUSTED TO 365 DAYS
Reported in pounds of yearling weight of direct progeny, relative to the average.
Higher values are usually more favourable dependant on its relationship with birthweight.
CARCASE EPD’S – ADJUSTED TO 475 DAYS OF AGE.
CARCASE WEIGHT
Reported as pounds of Carcase Weight relative to the average.
Higher values are usually more favourable, however this is relevant to each producers target martet.
RIB EYE AREA
Reported as square inches relative to the average.
Higher values are usually more favourable.
FAT
Reported as inches of back fat relative to the average.
Higher values are usually more favourable, however this is requires a balance between adequate doing ability
in daughters and carcase fat thresholds for target markets.
YIELD GRADE
Reported as expected differences in progeny average USDA Yield Grade scores.
Yield Grade is used to improve the yield potential of progeny and may seem a strange value for Australian animals. Whilst Australian animals will never receive a USDA graded Yield Grade score, they will also never receive an actual Retail Beef Yield % value either. However, US Shorthorns (including progeny of Australian sires used in the US) are USDA graded each year and so the pedigree linkages provide linkage to actual
USDA Yield Grade values.
Lower values are usually more favourable, however because of the negative correlations between fat and yield it is important to maintain some balance in the selection.
MARBLE SCORE
Reported as the differences in actual carcase marble scores relative to the average.This is different to IMF% which is used as an indicator trait in Marble Score. Higher values are more favourable.
ALL PURPOSE $INDEX – API
Though EPDs allow for the comparison of genetic levels for many economically important traits, they only provide a piece of the economic puzzle. That’s where $ Indexes come in. Through well conceived, rigorous mathematical computation, $ Indexes blend EPD’s and economics to estimate an animal’s overall impact on your bottom line.
The All Purpose $Index (API) evaluates sires for use on the entire cow herd, bred to both first-calf heifers and mature cows, with the portion of their daughters required to maintain herd size retained and the remaining heifers and steers put onto feed and marketed for both quality grade and yield.
UNDERSTANDING ACCURACIES
BOLT EPD accuracies have experienced the most change, usually lowering numerically and especially for non-parent animals, however the reported accuracy will be more accurate.
Accuracy refers to the amount a reported EPD can possibly change as more data is added. EPD values with higher accuracy result in less possible change for the value over time. More accurate accuracies better represent the amount of possible change for each EPD.

Find out what is happening
Latest News