CAUSES OF DATA BIAS
Any genetic evaluation is only as good as the data that is submitted. For each member to ensure that they are getting the most from their IGS evaluation, it is important to understand some of the key issues that can cause data bias within on farm record keeping.
Ultimately, any genetic evaluation can only know what it is told. No system has a psychic ability, so if the data isn’t captured and entered, then it doesn’t count towards the EPD prediction.
PARTIAL CG MEASUREMENTS
This is a common form of data bias within a genetic evaluation. Obviously, not all cattle are retained within the herd indefinitely, so not all animals can be measured for every trait, however it is important to measure all animals that are available in each contemporary group (CG).
Partial CG measurement is one of the most glaring issues in genetic evaluation.
Here is a simple example of data bias from partial CG measurements.
WEIGHTS
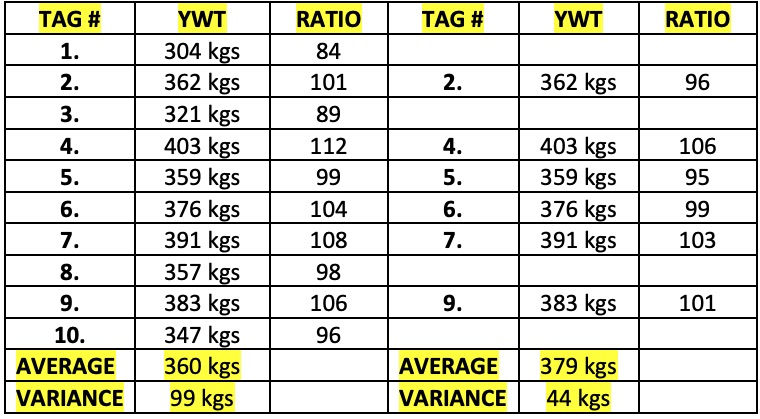 In this table, a breeder has a CG of 10 weaner heifers with an average adjusted yearling weight of 360 kilograms and a variation of 99 kilograms between the heaviest and lightest female.
Now let’s assume that he is committed to joining 60% of his heifers. Normally, the heaviest heifers are the majority of the ones joined and his retained heifers are the only ones that he chooses to take a yearling weight on.
The average of the 60% retained heifers is now 379 kilograms and the variation is only 44 kilograms.
The first thing to notice is that the in the full CG, Tag 2 and Tag 6 are both above average for Yearling weight, whilst in the 60% retained group, both heifers are now below average within the group and Tag 5 is now well below average. The other thing to notice is that Tag 4 had a ratio of 112 and now has a ratio of 106.
EPD prediction will still recognise that the Tag 4 is heaviest and it might be natural to assume that since the average Yearling weight increased in the retained CG, that the EPD prediction would be higher. However, the opposite is usually true. Because the variance within the retained CG is less than half the whole CG, the EPD prediction for the heifers in the retained CG will be lower than it would be compared to submitting weights from the whole CG. Remember too, that the yearling weight data informs more than just the Yearling Weight EPD, it also informs BWT, WWT, ADG, CWT and REA EPD’s, so the effect can be quite profound on EPD’s for all the animals in that retained CG.
The same is true of other traits, such as Ultrasound. Accurate data collection and submission leads to more accurate EPD information and therefore more genetic progress for breeders. But only measuring partial CG data, can reduce the accuracy and bias results.
Always remember that “Measuring your worst animals will make your best animals look better.”